OpenTelemetry is the observability default now — here's what that actually means for your stack
OpenTelemetry crossed a threshold in 2026 that matters more than any single download number: it stopped being something you evaluate and became something you inherit. When you hire a new backend engineer and they ask what observability stack you're running, OTel is the answer they expect. When you spin up a new service and reach for instrumentation, OTel is the library you reach for. The CNCF project that started as a merger of OpenCensus and OpenTracing in 2019 has, seven years later, won the instrumentation standard wars decisively.
The numbers support that characterization. As of early 2026, 48.5% of organizations are actively using OpenTelemetry, with another 25% planning implementation. 81% consider it production-ready. The Python SDK alone registered 224 million downloads in January 2026 — 6 million per day. The CNCF's own reporting showed a 43% increase in commits and a 50% increase in merged pull requests in 2025. OpenTelemetry is not a niche tool for observability enthusiasts; it's infrastructure.
What OTel actually standardizes — and what it doesn't
OpenTelemetry standardizes three things: the APIs for instrumenting code (how you emit telemetry data), the SDKs for collecting and processing that data, and the OTLP protocol for transmitting it to a backend. What it does not standardize is where the data goes or what you do with it once it arrives.
This is the crucial architectural distinction. OTel is a pipe, not a database or a visualization layer. You can send OTel data to Grafana, Datadog, Honeycomb, Dynatrace, Elastic, Jaeger, Prometheus, or any backend that speaks OTLP — which, as of 2026, is essentially all of them. The 36% year-over-year increase in vendor-sourced OTel distributions (vendors shipping their own OTel-compatible collectors and SDKs) reflects the market catching up to this reality: if your observability backend doesn't support OTel ingestion natively, you're at a competitive disadvantage.
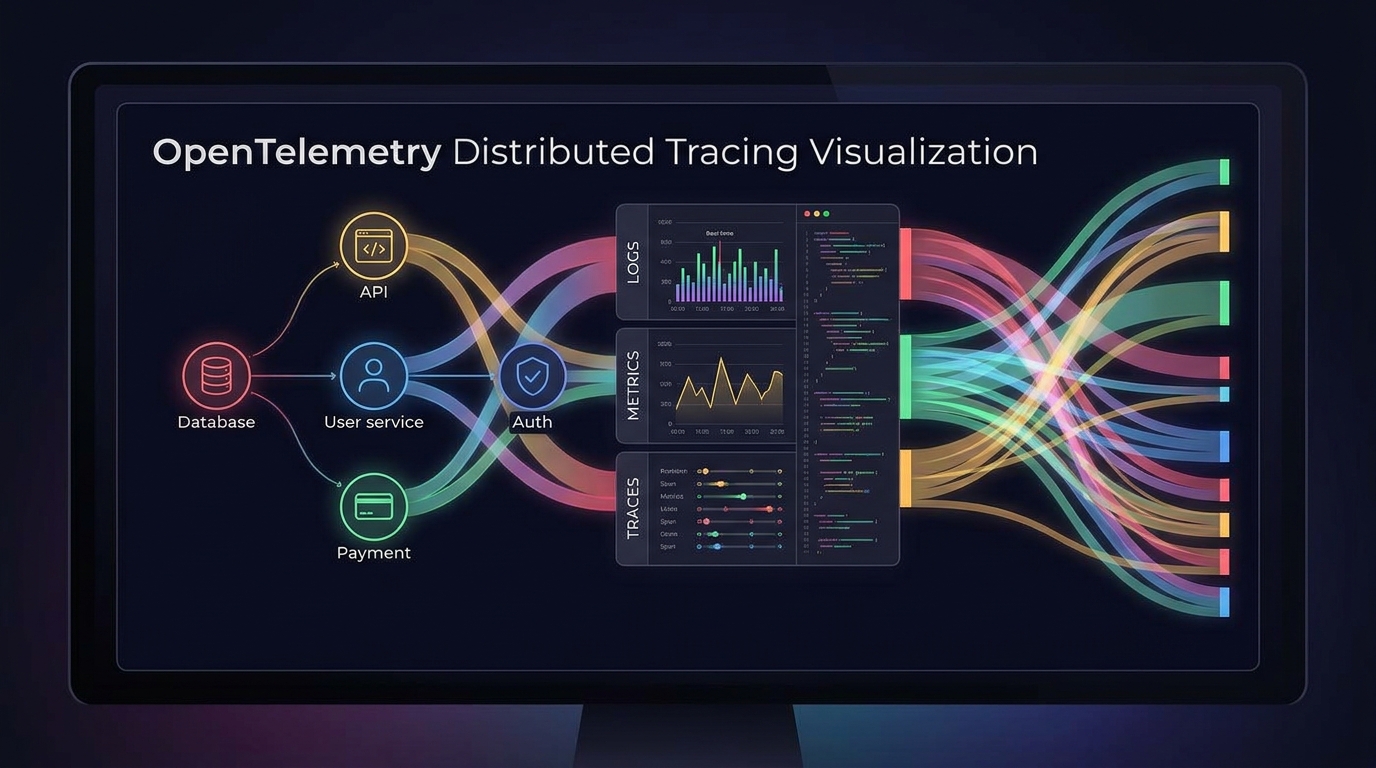
The three telemetry signals OTel covers are traces (distributed traces through a request's path across services), metrics (numeric measurements over time — latency, error rates, throughput), and logs (structured event records). In 2026, traces are the most mature and widely used (50.2% of OTel users), followed by metrics (57%) and logs (48.4%). Profiles — continuous profiling data — are an emerging fourth signal that 9.2% of users are now instrumenting, an early indicator of where OTel's scope is heading.
The Collector: where most production complexity lives
The OpenTelemetry Collector is the component that does the actual data processing — receiving telemetry from instrumented services, applying transformations and filtering, and forwarding to one or more backends. 65% of production OTel users run more than 10 Collectors; large deployments run hundreds. Kubernetes remains the dominant deployment environment (81%), though VM-based deployments have grown significantly (from 33% to 51%), reflecting adoption in environments that haven't containerized everything.
The Collector's pipeline model — receivers, processors, exporters chained together — gives it flexibility that's both powerful and operationally complex. A common production pattern: a sidecar Collector per pod that handles initial data collection and basic filtering, feeding into a gateway Collector cluster that applies sampling, enrichment, and routing logic before forwarding to backends. This two-tier architecture separates per-service instrumentation concerns from cluster-wide processing concerns, which matters at scale.
The most common operational problem in OTel deployments at scale is cardinality management. High-cardinality labels on metrics — using user IDs, request IDs, or other unbounded values as metric label dimensions — can cause metric series to explode, creating memory and storage costs that make observability more expensive than the systems being observed. The Collector's filter and transform processors can enforce cardinality bounds, but this requires deliberate configuration that teams often don't prioritize until they hit the problem.
Instrumentation: automatic vs manual
OTel's auto-instrumentation libraries handle the majority of common instrumentation needs without code changes. For Java applications, the Java agent auto-instruments HTTP clients and servers, JDBC, gRPC, Kafka, Redis, and dozens of other libraries by attaching at the JVM level. For Python, Node.js, .NET, Go, and other supported languages, similar auto-instrumentation covers the frameworks and libraries most applications use.
Auto-instrumentation gets you 80% of the value with minimal effort. The remaining 20% — instrumenting your actual business logic, adding custom attributes that carry domain context, creating spans for operations that don't map to library calls — requires manual instrumentation using OTel's API. The disciplines are different: auto-instrumentation is a deployment configuration problem, manual instrumentation is a code quality and architectural understanding problem.
The highest-value manual instrumentation targets aren't generic "add spans to everything" advice — they're specific to what makes your system's behavior observable for debugging purposes. What are the operations whose latency distribution you need to understand? What are the domain-level attributes (customer tier, feature flag values, resource identifiers) that you need to correlate across services when investigating an incident? Manual instrumentation that answers those questions is worth far more than uniform coverage of everything.
Sampling: the unresolved tension
Tracing every request at full detail in a high-volume production system is economically impractical. A service handling 10,000 requests per second generates enormous trace volumes if every request produces a complete trace. Sampling — recording only a fraction of traces — is a practical necessity, but it creates a fundamental tension: the traces you most need for debugging (error paths, slow outliers, unusual sequences) are exactly the traces you're most likely to miss if you sample naively.
Head-based sampling (deciding whether to trace a request at the start) is simple to implement but blind to outcomes — you can't know whether a request will be interesting until it completes. Tail-based sampling (deciding after the fact, keeping traces that meet criteria like error occurrence or latency threshold) is more intelligent but requires buffering complete traces before making sampling decisions, which adds latency and memory overhead to the Collector.
OTel's Tail Sampling Processor implements tail-based sampling in the Collector, and it's available in production. The configuration is non-trivial — you need to define policies (keep all errors, keep requests over X milliseconds, keep a baseline random sample of everything else) and tune buffer sizes appropriately. Teams that invest in tail sampling setup get dramatically better signal-to-noise ratio on their traces. Teams that use head-based sampling with a fixed rate get adequate coverage for most purposes but miss the long tail of interesting events.
Where OTel is heading: profiles and beyond
The CNCF has OpenTelemetry on track for Graduated project status in 2026 — the highest maturity designation in the CNCF lifecycle, currently held by projects like Kubernetes, Prometheus, and Envoy. Graduating OTel signals that the project is stable, widely deployed, and has demonstrated the governance maturity to be considered foundational infrastructure.
The next capability frontier is continuous profiling — the fourth telemetry signal that OpenTelemetry is extending to cover. Continuous profiling captures CPU, memory, and goroutine/thread-level data from running processes on a recurring basis, allowing correlation between trace-level performance and the actual code executing during slow requests. Correlating a slow trace with a CPU profile that shows which function was burning cycles during that request window is exactly the kind of multi-signal analysis that OTel's unified data model makes possible.
If you're not running OTel in 2026, you're not behind a technology curve — you're behind an industry standard. The evaluation phase is over. The question is how to instrument, collect, and route your telemetry data effectively using tools that have now broadly converged on OTel as the foundation.